Article Directory
It’s difficult to recall the exact moment the floor fell out. For most, it was a blur of red candles on a screen, a cascade of liquidation alerts that sounded like a casino paying out in reverse. In a single hour, $7 billion in leveraged positions were vaporized. By the time the dust settled, the total carnage was nearly $9.6 billion, the largest single-day wipeout in crypto’s history. Bitcoin shed $12,000 in minutes. Solana, along with the rest of the altcoin market, bled out even faster.
The catalyst was a tweet. Headlines like ‘Trump Surprise’ Triggers Huge Crypto ‘Flash Crash’ As Traders Brace For Bitcoin, Ethereum, XRP, BNB And Solana Price ‘Wipeout’ captured the shock—a sudden, aggressive 100% tariff on Chinese imports that sent shockwaves through every market on the planet. But macro shocks don’t create weakness; they reveal it. The story of Solana’s catastrophic drop from its institutional-fueled highs wasn’t written on October 11th, 2025. The data shows it was written weeks, even months, before. The question isn't what happened, but why so few were looking at the right numbers.
The Institutional Siren Song
Just 24 hours before the crash, the narrative couldn't have been more different. The dominant theme was institutional arrival, exemplified by headlines such as Solana Price Prediction: Public Company Taps Coinbase to Buy Millions in SOL – Wall Street is Here. Sharps Technology, a publicly traded company, had just announced it had tapped Coinbase to custody its massive Solana treasury, which had already swelled to 2 million SOL (valued at over $440 million at the time). Wall Street, we were told, was here. Price predictions, consequently, were adjusted upwards. Analysts were targeting $300 in the short term, with a longer-term bull case for $600 per SOL.
This wasn't just idle speculation. The move by Sharps was a significant signal. Public companies don't typically make nine-figure, unhedged bets on volatile digital assets. And this is the part of the story that I find genuinely puzzling. The decision to not only acquire such a position but to publicly announce its custody with a premier institutional partner like Coinbase suggested a level of conviction that permeated the market. It was the ultimate "smart money" endorsement.
This institutional narrative was reinforced by other metrics. Solana's Total Value Locked (TVL) was hitting new highs, touching $42.4 billion. Exchange Traded Products (ETPs) were seeing record inflows, hauling in $706 million in a single week—a 127% jump over the previous all-time high. On the surface, the data screamed strength. Big money was placing its chips on Solana's scalability and efficiency. The problem is, TVL and ETP flows are institutional metrics. They tell you what a handful of large, slow-moving entities are doing. They don't tell you what the rest of the market is thinking.
A Divergence of Data and Narrative
While the headlines focused on nine-figure treasury purchases, a quieter, more concerning story was unfolding in the on-chain data. The market was exhibiting a classic divergence. There was a growing gap between the price, which was being propped up by these large buys, and the actual network usage. Economic (non-vote) transactions were robust, but they weren’t translating into sustained price momentum. The price action was stuck, repeatedly failing to break the critical $230 resistance level.
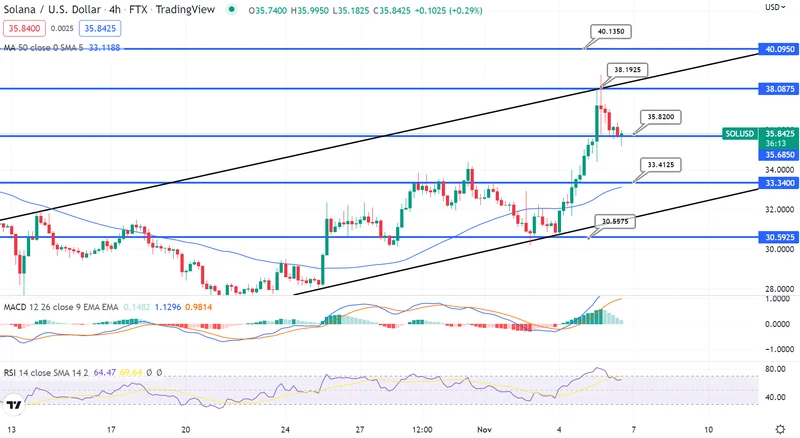
This is where we must be precise. While Solana’s weekly transaction throughput was impressive, more than 4 times that of its competitor, the Binance Smart Chain—to be more exact, 4.4 times its throughput—this activity wasn’t creating demand pressure. It’s like an engine revving in neutral. There's a lot of noise, but the car isn't moving forward. The Relative Strength Index (RSI), a key momentum indicator, was hovering around 40, signaling weakness, not strength.
Even more telling was the capital rotation. In the 30 days leading up to the crash, Binance Coin [BNB] had rallied over 50%, while SOL had managed a paltry 1.5% gain. The SOL/BNB ratio, a direct measure of relative strength, had collapsed to its lowest point since the fourth quarter of 2023. This wasn't an anti-SOL market, per se, but it was clear that speculative capital—the lifeblood of any bull run—was chasing returns elsewhere. The institutional bid was acting as a dam, holding the price steady while the river of retail and trader interest was being diverted.
This entire setup was a textbook example of a fragile market structure. The price was supported by a narrow pillar of institutional buying and a compelling narrative, while the broad foundation of market-wide participation was eroding underneath. It was a structure that could hold under calm conditions but was destined to shatter at the first significant shock. The "Trump Surprise" wasn't the cause of the collapse; it was simply the force that tested a foundation that was already cracked.
The Data Was Always the Answer
The post-mortems will focus on the macro trigger, the unpredictable nature of geopolitics, and the dangers of leverage. All are valid points. But the most important lesson is one of signal versus noise. The $440 million treasury purchase was noise—a loud, headline-grabbing event that drowned out the subtler signals. The real signal was in the capital rotations, the failing technical breakouts, and the divergence between institutional flows and broad market conviction.
The $600 price target was never a reflection of fundamental value; it was a projection based on a narrative. And narratives are the first casualty of a market panic. The data, however, remains. It showed a market losing momentum and a rally that was running on fumes. The crash wasn't a black swan; it was a simple, brutal lesson in paying attention to the right numbers.